
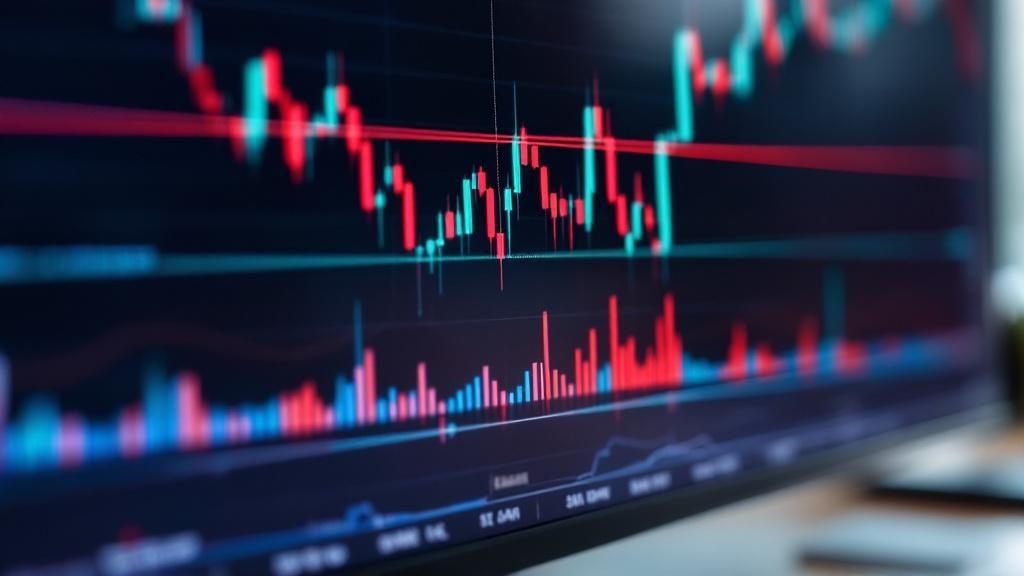
If you've ever felt lost trying to figure out where a currency pair might be headed next, you're not alone. FX pivot points are like a daily roadmap for traders, calculated using the previous day's high, low, and closing prices. They lay out a series of potential support and resistance levels for the current trading day, giving you a framework to anticipate where the price might react before the market even gets going.
What Are FX Pivot Points and Why Do They Matter
Think of it like this: trying to trade the forex market without a plan is like sailing without a compass. You might get somewhere eventually, but it's going to be a stressful, inefficient journey. FX pivot points are that compass. They provide a clear structure to what can otherwise feel like a chaotic market, helping you identify potential turning points and get a sense of market sentiment.
The real beauty of pivot points is that they are predictive, not lagging. Most indicators just confirm what has already happened, but pivots use yesterday's price action to project a potential roadmap for today. That's a massive advantage, letting you build a game plan before you even think about placing a trade.
The Market's Psychological Compass
So, why do these simple lines on a chart work so well? It's all about collective psychology. From individual retail traders to the big institutional players, everyone is watching the same pivot levels. This creates a powerful self-fulfilling prophecy; because traders expect a reaction at these levels, their actions cause the very reaction they were anticipating.
Pivot points essentially act as the market's centre of gravity for the day. They show a point of balance between buyers and sellers, and how the price behaves around them often tells you who's in control.
When so many eyes are on the same levels, these simple mathematical calculations become major zones of interest. For a trader, this translates into tangible benefits:
- Clear Entry and Exit Points: They give you objective, pre-calculated levels for placing trades, setting stop-losses, and taking profits.
- Gauging Market Direction: Is the price trading above or below the central pivot point? This gives you a quick read on the day's likely bias (bullish or bearish).
- Building a Strategic Framework: They provide a consistent structure that helps take the emotion out of your decisions and promotes disciplined trading.
To really appreciate why pivot points are so useful, it helps to see where they fit in the grand scheme of things. They are a tool of technical analysis, which is a very different beast from other methods. For a great breakdown, it’s worth understanding the difference between fundamental and technical analysis. Knowing this context makes it clear how pivots offer such a unique, forward-looking view of the market.
Calculating the Core Pivot Point Levels
At its heart, the maths behind standard fx pivot points is refreshingly simple. You don't need a fancy algorithm or expensive software. All it takes are three key bits of data from the previous trading day: the high price, the low price, and the closing price. These three numbers are the foundation for everything that follows.
The central pivot point (PP) is the linchpin of the whole system. Think of it as the day's primary balance point, and every other support and resistance level is calculated from it. That's why getting this first calculation right is so important.
The Basic Pivot Point Formula
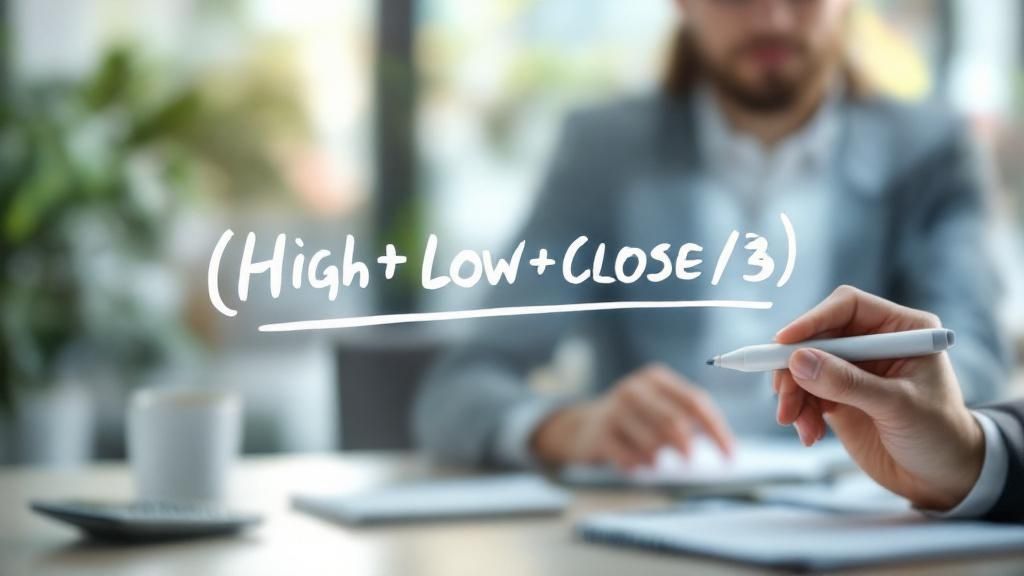
The formula itself is just an average of those three key prices from the last session. To find the central pivot point, you simply add the high, low, and close together, then divide the total by three.
Pivot Point (PP) = (Previous High + Previous Low + Previous Close) / 3
This one number gives you a baseline for the market's mood. If the current price is trading above this level, it’s a sign of bullish strength. On the flip side, if the price drops below it, the bears are likely in control for the session.
Traders right here in South Africa use this exact method to pinpoint important levels for support and resistance, which is vital for making smart entry and exit calls in the fast-paced forex market. Its simplicity is what makes it so popular worldwide, and you can discover more insights about forex pivot points on Dukascopy to see just how widely it's applied.
Building Out Support and Resistance Levels
Once you have that central pivot point, you can start building out the rest of the structure: the support and resistance levels. These are your potential floors and ceilings where the price might stall, reverse its course, or break through with force.
The first layer of support (S1) and resistance (R1) are calculated using the pivot point and the range of the previous day (High - Low).
- Resistance 1 (R1) = (2 x PP) - Previous Low
- Support 1 (S1) = (2 x PP) - Previous High
These first levels are often the most important ones to watch. Many day traders keep a close eye on R1 and S1 for potential reversal signals or breakout opportunities—they represent the first major hurdles for the price to clear.
As we move further away from the central pivot, the second and third levels of support and resistance help identify more extreme price movements. These levels tend to come into play when the market is particularly volatile or caught in a strong trend.
Here are the formulas for the second levels:
- Resistance 2 (R2) = PP + (Previous High - Previous Low)
- Support 2 (S2) = PP - (Previous High - Previous Low)
And for the third levels, which often mark points where a trend might run out of steam:
- Resistance 3 (R3) = Previous High + 2 x (PP - Previous Low)
- Support 3 (S3) = Previous Low - 2 x (PP - Previous High)
Let’s pull all of this together into a handy table for quick reference.
Standard Pivot Point Formulas
This table breaks down the standard formulas you'll need to calculate the seven key pivot levels for any trading session.
| Level | Calculation Formula |
|---|---|
| Resistance 3 (R3) | High + 2 x (PP - Low) |
| Resistance 2 (R2) | PP + (High - Low) |
| Resistance 1 (R1) | (2 x PP) - Low |
| Pivot Point (PP) | (High + Low + Close) / 3 |
| Support 1 (S1) | (2 x PP) - High |
| Support 2 (S2) | PP - (High - Low) |
| Support 3 (S3) | Low - 2 x (PP - High) |
Note: All "High," "Low," and "Close" values refer to the previous session's prices.
By plotting these seven levels on your chart, you create a complete framework for the trading day. This isn't just a set of random lines; it's a predictive map built on the previous day's market consensus, giving you a powerful guide for what might happen next.
Exploring Different Types of Pivot Points
While the standard pivot point is a brilliant starting point, it's really just the tip of the iceberg. The forex market isn't a one-size-fits-all game. Some days are quiet and range-bound, while others are driven by powerful trends. To navigate this, you need the right tool for the job, and that’s where different fx pivot point variations come in.
Think of it like having a toolbox full of screwdrivers. You wouldn't use a tiny glasses screwdriver to assemble a piece of furniture, would you? In the same way, different pivot types are fine-tuned for specific market conditions and trading styles.
Each variation tweaks the original formula, putting a little more emphasis on different data points from the previous day's session. The result is a unique set of support and resistance levels, each giving you a slightly different perspective on the market.
Woodie's Pivot Points
Woodie's pivots are for traders who believe the previous day's closing price tells the most important story. The logic is solid: the close is where the market finally settled, reflecting the day's ultimate sentiment.
This method gives the closing price double the weight in its calculation, making the pivot point more sensitive to the most recent market action.
Woodie's Pivot Point (PP) = (High + Low + 2 x Close) / 4
Because of this tweak, the pivot point often sits closer to the previous day's close. If you're someone who focuses on short-term sentiment shifts, Woodie's pivots can give you a real edge.
Camarilla Pivot Points
If you're a scalper or an intraday trader who loves fast-paced action, Camarilla pivots should be on your radar. Developed back in the 1980s, their unique formula generates a tight cluster of eight levels—four support and four resistance—that hug the current price much more closely.
What's the point? Camarilla pivots are specifically designed for two main strategies:
- Mean Reversion: Traders often watch for price to hit the third support (S3) or resistance (R3) levels, anticipating a snap-back towards the average.
- Breakout Trades: A decisive move past the fourth support (S4) or resistance (R4) level is seen as a strong signal that a new trend is taking hold.
Since these levels are so close together, they can generate more frequent trading signals, which is exactly what day traders operating on lower timeframes are looking for.
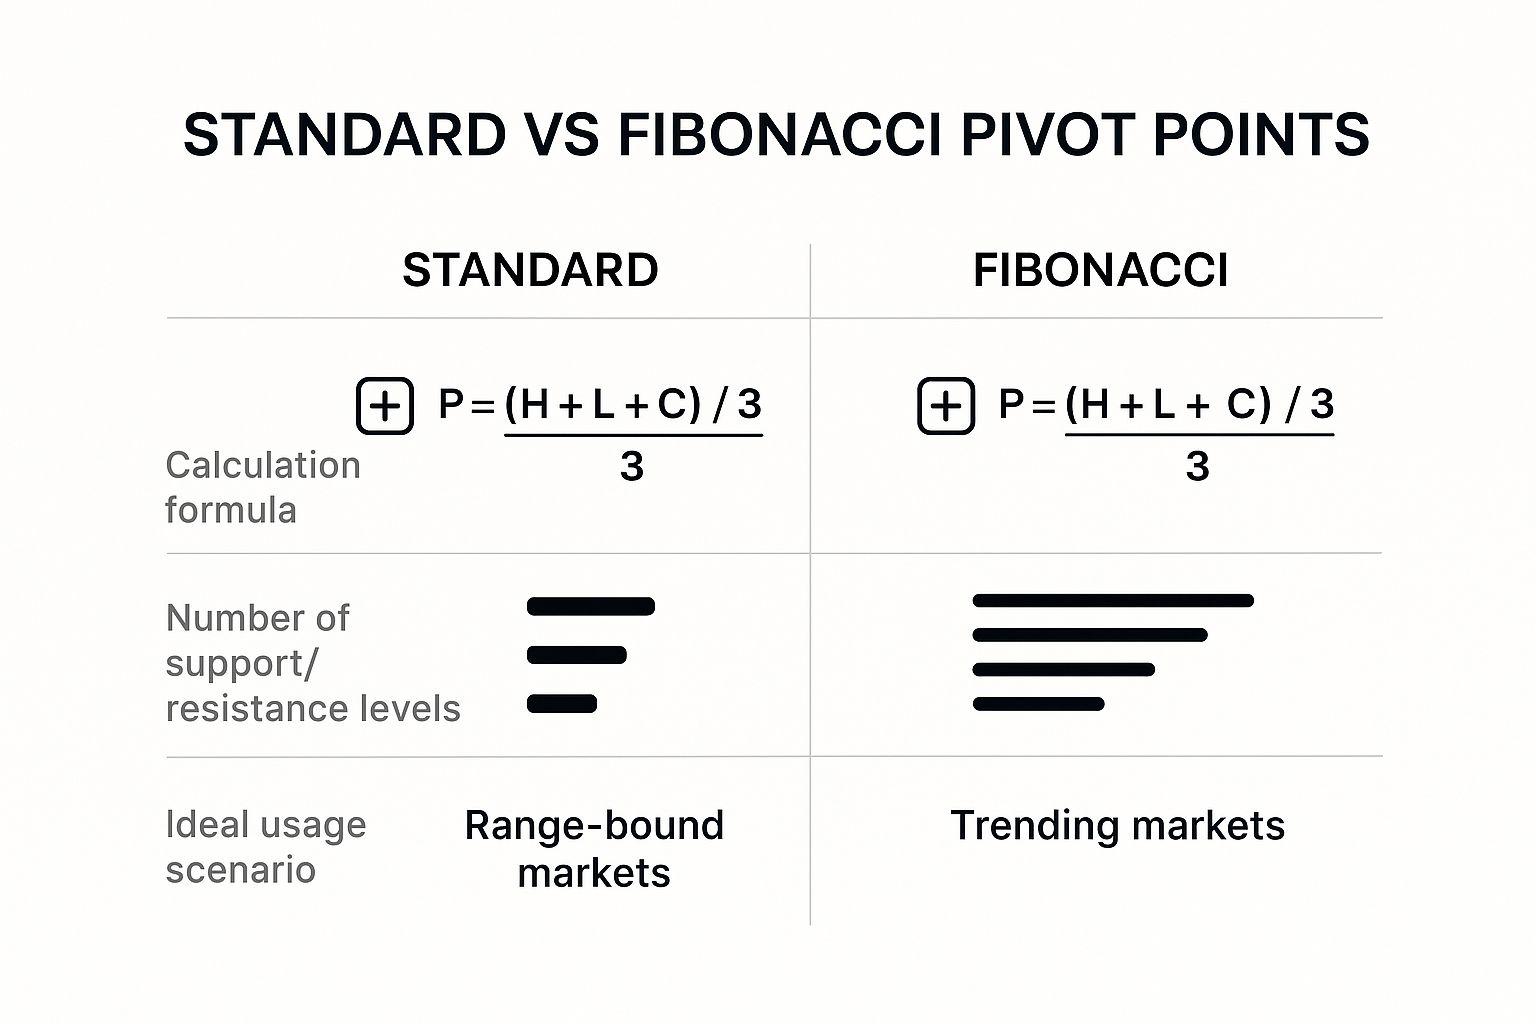
Fibonacci Pivot Points
For those who see the psychological patterns in the market, Fibonacci pivot points are a fascinating tool. This method takes the standard pivot point calculation but then applies the famous Fibonacci ratios—38.2%, 61.8%, and 100%—to map out the support and resistance levels.
The formula uses these ratios against the previous day's trading range (High - Low).
- Resistance 1 (R1) = PP + (0.382 * (High - Low))
- Support 1 (S1) = PP - (0.382 * (High - Low))
- Resistance 2 (R2) = PP + (0.618 * (High - Low))
- Support 2 (S2) = PP - (0.618 * (High - Low))
The theory is that these ratios correspond with natural psychological levels where traders tend to place their orders, creating built-in zones of support and resistance. This makes Fibonacci pivots particularly useful in trending markets for spotting potential retracement points where you can join the trend.
The image below gives a great visual comparison between the standard pivot point and the Fibonacci variation.
Comparison of Pivot Point Calculation Methods
To make things even clearer, let's break down how these different pivot types stack up against each other. Each one serves a slightly different purpose, and knowing which to use can make a big difference in your analysis.
| Pivot Type | Key Feature | Best Suited For |
|---|---|---|
| Standard | Balanced calculation using High, Low, and Close. | General-purpose, all-around analysis for most market conditions. |
| Woodie's | Puts extra weight on the previous session's closing price. | Short-term traders focused on the most recent market sentiment. |
| Camarilla | Levels are clustered very close to the current price. | Scalpers and day traders looking for breakout and reversal signals. |
| Fibonacci | Uses Fibonacci ratios to calculate support and resistance. | Traders in trending markets looking for key retracement levels. |
Ultimately, the best pivot point is the one that aligns with your trading strategy and the current personality of the market. There's no single "correct" answer—only the one that works for you.
Actionable Strategies for Trading Pivot Points

Alright, now that we’ve covered the "what" and "how" of calculating fx pivot points, let's get to the exciting part: turning that theory into a practical trading plan. These levels are much more than simple lines on a chart; they paint a vivid picture of the constant tug-of-war between buyers and sellers.
Think of the central pivot point as the day's unofficial battle line. When the price is trading above it, the bulls are generally seen as having the upper hand. If the price slips below, the bears are in control.
This simple observation is the foundation for almost every pivot point strategy. Your job as a trader is to watch how the price behaves around these pre-calculated levels and use that information to make intelligent, high-probability decisions. Let's dive into two of the most effective strategies you can start using right away.
Strategy 1: The Pivot Point Bounce
The pivot point bounce, often called a reversal or range-trading strategy, is built on a simple premise: support and resistance levels are likely to hold. It’s a favourite among traders when the market is consolidating or just chopping sideways without a clear, powerful trend.
The goal is to catch the moment the price approaches a key pivot level and then "bounces" off it, reversing its direction. Simple, but powerful.
Here’s how you can put this into practice:
- Read the Room: First, gauge the market condition. This strategy shines in a non-trending, range-bound market. If the price is making big, aggressive moves in one direction, trying to catch a bounce can be like stepping in front of a freight train.
- Wait for the Approach: Patience is a virtue here. Watch as the price moves towards a key support (S1, S2) or resistance (R1, R2) level. Don't jump the gun.
- Look for Confirmation: This is the most crucial step. Never, ever trade on a level alone. You need a confirming signal that a reversal is actually happening. This could be a classic candlestick pattern, like a hammer forming at support or a shooting star at resistance. Even seeing momentum slow down as it hits the level is a good sign.
- Execute the Trade: Once you have that confirmation, you can confidently enter a trade. For a bounce off a support level, you'd go long (buy). For a rejection at a resistance level, you'd go short (sell).
A price level is just an area of interest; a candlestick pattern or indicator signal at that level is the reason to act. Without confirmation, you're just guessing.
Managing your risk is just as important as your entry. A logical place for a stop-loss is just below the support level for a long trade, or just above the resistance level for a short one. As for your take-profit target, aiming for the next pivot level is a common and sensible approach.
Strategy 2: The Pivot Point Breakout
While the bounce strategy is perfect for quiet markets, the breakout strategy is your go-to when volatility picks up and a new trend is born. A breakout happens when the price doesn't just tap a pivot level but smashes through it with conviction, signalling a powerful shift in market sentiment.
Trading breakouts is all about catching the very beginning of a new, powerful move. You’re essentially joining the momentum as soon as it's clear that a previous barrier has failed.
Here’s a step-by-step approach to trading breakouts:
- Identify a Strong Level: Wait for the price to approach a significant support or resistance pivot.
- Watch for the Break: The key is to see a strong, decisive candle close beyond the pivot level. A tiny wick poking through doesn't cut it. You want to see genuine momentum and commitment from the market.
- Enter on Confirmation: Some traders jump in as soon as the breakout candle closes. A more conservative approach is to wait for a small pullback to the broken level—which now acts as new support (in an uptrend) or new resistance (in a downtrend)—and then enter the trade.
- Set Your Parameters: Place your stop-loss on the other side of the pivot level you just traded through. Your profit target could then be the very next pivot level in the direction of the breakout.
In the forex markets, these levels become particularly potent because they are a self-fulfilling prophecy, something traders in the ZA region and beyond rely on. So many people are watching these exact psychological price points that massive buying or selling pressure often builds up around them.
A well-known guideline is the 70-80% rule, which suggests the central pivot point is touched during the trading session in about 70-80% of cases. You can explore a detailed analysis of the role of pivot points in forex trading on Scribd.
Whether you choose to trade bounces or breakouts, the core principle is the same: use pivot points as your map, wait for the market to show its hand, and always, always manage your risk with discipline.
Strengthening Your Signals with Other Indicators
While FX pivot points give you a fantastic roadmap for the trading day, relying on them alone can be a bit like navigating with just one landmark. The best traders I know treat a single pivot level as a strong suggestion, not a cast-iron rule. They build a solid case for every trade by looking for confirmation from other sources. It's about turning a whisper of a potential trade into a confident shout.
Think of it like getting a second opinion. When different tools, each looking at the market through a slightly different lens, all point to the same conclusion, your chances of making a good call go way up. Layering indicators on top of your pivot analysis helps filter out the market noise and gives you that extra conviction before putting your capital on the line.
Combining Pivots with Candlestick Patterns
One of the most immediate and powerful ways to confirm a pivot point signal is to watch the price action unfold through candlestick patterns. These patterns are a brilliant visual story of the tug-of-war between buyers and sellers, giving you a real-time peek into market sentiment right at a critical price level.
Let’s say the price is drifting up towards the R1 resistance level. Instead of jumping into a short trade right away, you wait and watch. If a classic bearish pattern, like a shooting star or a bearish engulfing candle, forms right on that R1 line, the argument for a reversal just got a whole lot stronger.
Here are a few classic combos to keep an eye on:
- Bullish Reversal: A Hammer or Bullish Engulfing pattern appears at an S1 or S2 support level.
- Bearish Reversal: A Shooting Star or Bearish Engulfing pattern pops up at an R1 or R2 resistance level.
- Indecision: A Doji candle forms right on a pivot point, suggesting momentum is stalling and a change of direction could be just around the corner.
Using Moving Averages to Confirm the Trend
Moving averages are my go-to for a quick read on the overall trend. Pairing them with pivot points helps you decide whether to look for breakouts or play reversals. For instance, if the price is consistently trading above a 50-period moving average, the underlying trend is bullish. This makes a breakout trade above a resistance pivot look much more promising.
On the flip side, if the price is stubbornly staying below the moving average, the trend is bearish. In that situation, you’d feel more confident taking short trades as price bounces off a resistance level or breaks down through support. It’s a simple check that helps ensure you’re swimming with the current, not against it.
A pivot level might hint at a potential reversal, but a moving average confirms if that reversal actually fits with the market's bigger picture. This combo is key to staying on the right side of the trend.
Forex trading is taking off in South Africa, and many local traders use these exact techniques to navigate the markets. While region-specific data can be sparse, the universal strategy of combining pivots with indicators like moving averages provides much stronger signals. This multi-indicator approach is a cornerstone for traders everywhere because it reinforces decisions at those make-or-break price levels.
Adding Oscillators for Momentum Insights
Finally, don't forget about oscillators. Tools like the Relative Strength Index (RSI) or the Stochastic Oscillator add a crucial layer by showing you market momentum. They tell you if a market is getting a bit stretched and is either overbought (and might need a breather) or oversold (and could be ready for a rally).
The real magic happens when these oscillator signals line up perfectly with a pivot level. Imagine the price drops to the S2 support level just as the RSI dips below 30 into oversold territory. Now you have a powerful confluence of signals screaming that a bounce is highly likely. The same goes for an overbought RSI reading (above 70) at an R2 resistance level—it makes the case for a short trade that much more compelling. To get a complete picture, it's always a good idea to integrate your strategies with professional market analysis tools, which can bring all these elements together on one chart.
Common Mistakes to Avoid When Using Pivot Points
Knowing how to calculate and plot FX pivot points is one thing, but sidestepping the common traps is what separates consistently profitable traders from the rest. It’s easy to fall into bad habits, so let’s walk through the mistakes I see traders make time and time again.
The biggest blunder? Treating pivot levels like impenetrable walls. A trader sees the price nearing the S1 support level and instantly throws in a buy order, almost praying for a rebound. That's not a strategy; it's a gamble.
Pivot points are simply areas of interest—zones where the market is more likely to react. They aren't magical lines that guarantee a reversal. Without waiting for some kind of confirmation, like a clear bullish candlestick pattern or an oscillator showing an oversold condition, you're just trading on blind faith.
Trading Pivots in Isolation
Here’s another classic error: relying on pivot points and nothing else. The market is a complex beast, and no single indicator can give you the full picture. Using pivots alone is like trying to solve a puzzle with half the pieces missing.
A pivot level can tell you where a trade might happen, but you need other tools to tell you why it's a good idea. Without that confluence, you’re just betting on a number.
Smart traders always look for confirmation. They build a case for every trade by layering different forms of analysis. For example, they might check if the price is above the 50-day moving average to confirm an uptrend before taking a long trade at a pivot support level. This simple cross-check helps filter out a lot of noise and low-probability setups.
Mismatching Timeframes and Strategy
Using the wrong pivot timeframe for your trading style is a mistake that can completely invalidate your analysis. It's like using a telescope to look at something right in front of you—the scale is all wrong.
A scalper who lives on the one-minute or five-minute charts gets almost no benefit from monthly pivot points. The levels are just too far apart to be of any practical use for the tiny moves they’re trying to catch.
Here’s a simple way to match them up:
- Scalpers and Day Traders: Stick to daily pivots. These levels are the most relevant for the current trading session.
- Swing Traders: If you're holding trades for a few days to a week, weekly pivots will give you a much better feel for the key levels in play.
- Position Traders: For those looking at the bigger picture over weeks or months, monthly pivots are essential for framing your long-term view.
Make sure your pivot calculation period aligns with how long you plan to be in a trade. This ensures your analysis is sharp, relevant, and actually useful for the decisions you need to make.
Got Questions About FX Pivot Points? We've Got Answers
Let's tackle some of the most common questions traders have about using FX pivot points. Getting these fundamentals right will help you trade with more clarity and confidence.
How Often Should I Recalculate My Pivots?
This really comes down to your trading style. There's no one-size-fits-all rule, but different timeframes suit different traders.
- Daily Pivots: If you're a day trader or a scalper, this is your sweet spot. You'll recalculate them at the close of each trading day, giving you a fresh map of key levels for the session ahead.
- Weekly Pivots: Swing traders holding positions for a few days will get more value from weekly pivots. These are calculated from the previous week's data and give you a broader perspective on the market's structure.
- Monthly Pivots: For long-term position traders, monthly pivots are the way to go. They zoom out to show you the major support and resistance zones that could dictate price action over weeks or even months.
Which Type of Pivot Point is Actually the Best?
This is a bit like asking which tool in a toolbox is the best—it depends on the job! No single pivot point formula is magically "more accurate" than another. The right one is the one that clicks with your strategy and the market's current behaviour.
Standard pivots are a fantastic, reliable starting point. Many traders find Fibonacci pivots work wonders in trending markets, while the tighter levels of Camarilla pivots are often a favourite for short-term range trading. My advice? Experiment with them and see which one feels right for you and your trading plan.
The "best" pivot point isn't a specific formula. It’s the one you truly understand and can apply consistently as part of a solid trading strategy.
Do Pivots Work for Every Currency Pair?
Absolutely. FX pivot points can be applied to any currency pair you can think of, from the majors to the exotics. Why? Because the formula only needs three simple data points: the high, low, and close. Every traded asset has that.
What you will notice, however, is that their effectiveness can feel different depending on a pair's personality. A highly volatile pair might blast through pivot levels, while a slower, less volatile pair might respect them with textbook precision. It’s crucial to get a feel for the specific currency pair you’re trading.
Ready to manage your international payments with the same precision you use in your trading? Zaro gives South African businesses access to real exchange rates with zero hidden fees, putting you back in control of your cross-border transactions. Stop losing money on bank markups and discover a smarter way to handle your forex. Explore what Zaro can do for you.