
At its most basic, calculating profit in Excel boils down to a simple formula: =Total Revenue - Total Costs. You just need one cell for your total income, another for your total expenses, and this straightforward subtraction will show you your profit. Honestly, this one formula is the cornerstone of understanding your business's financial health.
Your Quick Guide to Profit Formulas in Excel
Staring at a blank spreadsheet can feel a bit daunting, but let's cut right to the chase. This section will walk you through the essential formulas you need to start calculating profit immediately. We're going to break down the core concepts so you can see exactly how a few simple functions can reveal the real financial story of your business.
Think of this as your practical starting point, not just theory. You'll quickly get a handle on the difference between revenue and costs, which is the perfect foundation for digging deeper later on. Getting these fundamentals right is especially crucial for businesses in the ZA region, where local economic conditions can often be unpredictable.
For example, imagine a South African e-commerce business dealing with fluctuating exchange rates on imported goods. Using Excel to track profit margins becomes vital. If a product sells for R100 and its landed cost is R40, the profit is a simple calculation: =100-40, giving them R60. This kind of clear, immediate data helps businesses make smart, agile decisions when the market shifts. You can find more practical examples on how to calculate profit in Excel on Indeed.com.
Key Takeaway: When you're starting out, calculating profit in Excel is less about mastering complex formulas and more about organising your income and expenses logically. A clean, simple structure is your best friend.
To get you started on the right foot, it helps to be crystal clear on the terminology. I've put together a quick reference table to break down the key terms into plain English.
Key Profit Terms Explained
| Term | What It Means for Your Business | Simple Excel Formula Concept |
|---|---|---|
| Revenue | This is the total cash you bring in from sales before any costs are taken out. It's your top-line number. | =SUM(Sales_Column) |
| Cost of Goods Sold (COGS) | These are the direct costs tied to making or acquiring the products you sell, like raw materials and direct labour. | =SUM(Direct_Costs_Column) |
| Gross Profit | Your profit after subtracting the cost of the goods themselves. It shows how efficiently you produce and sell. | =Revenue - COGS |
| Operating Expenses | The day-to-day running costs of the business that aren't directly tied to a product, like rent, salaries, and marketing. | =SUM(Operating_Costs_Column) |
| Net Profit | The bottom line. This is what's left after all expenses (including taxes and interest) are deducted from your revenue. | =Gross_Profit - Operating_Expenses |
Once you're comfortable with these terms and how they relate to each other, you'll find that building a profit and loss statement in Excel becomes second nature.
Building Your Profit Tracking Spreadsheet
A messy spreadsheet is a fast track to financial confusion. If you want to calculate your profit in Excel accurately, you can't just throw a few formulas around. You need to build a clear, well-structured sheet from the ground up. Honestly, a well-designed tracker makes your monthly financial reviews so much less of a chore.
The absolute foundation of a good profit tracker is its columns. Start by giving every critical piece of financial data its own distinct column. Resist the urge to lump things together—separation is your best friend here.
Let's imagine you run a small online store in Cape Town selling local crafts. Here’s a practical setup I’d recommend:
- Column A: Date (When did the sale happen?)
- Column B: Product Name (What did you sell?)
- Column C: Units Sold (How many items?)
- Column D: Price per Unit (ZAR) (The selling price)
- Column E: Total Revenue (This is a formula:
=C2*D2) - Column F: Cost per Unit (ZAR) (The direct cost of making the craft)
- Column G: Total COGS (Another formula:
=C2*F2)
Layout and Formatting Tips
Simple formatting can make a world of difference. Here's a quick tip: select your financial columns (D through G in our example), right-click, and choose "Format Cells." From there, select "Currency." Make sure the symbol is set to "R" for the South African Rand. This tiny adjustment makes your sheet look more professional, easier to read, and helps prevent data entry mistakes.
If you’re just getting started with spreadsheets and want to get a better handle on the basics before diving in, this Excel for Dummies guide is a great resource to build a solid foundation.
Here’s a snapshot of what this initial setup should look like.
See how this layout cleanly separates your income from your direct costs? This structure creates the perfect stage for us to calculate gross profit, which we'll tackle next. After that, we’ll add columns for operating expenses to get the complete financial picture.
Getting to Grips with Gross Profit and Profit Margin
Alright, with your spreadsheet organised, it's time for the first real health check of your business: calculating your gross profit. Think of it as the money you make purely from selling your products or services, before taking out any overheads like rent, salaries, or marketing costs. It’s a powerful, direct look at how efficient your production is and whether your pricing strategy is on point.
The formula itself is beautifully straightforward. In your Excel sheet, you simply subtract the Cost of Goods Sold (COGS) from your Revenue. If your Total Revenue is in column E and your Total COGS is in column G, the formula for a single product would be =E2-G2. Simple as that.
Putting the Gross Profit Formula to Work
Let's see this in action using our Johannesburg-based retailer example. We want to work out the gross profit for each individual product and then a grand total for everything we've sold. Just add a new column, let's call it "Gross Profit", and pop in the formula.
To get the total gross profit for all your products combined, you can use the SUM function at the bottom of that new column. Something like =SUM(H2:H18) will do the trick.
Here’s a look at the gross profit formula applied to our sample data.
Instantly, that "Gross Profit" column tells a story. You can see at a glance which products are your real money-makers before we even start thinking about overheads.
Now, knowing your gross profit in Rands is one thing, but seeing it as a percentage really puts things into perspective. This is your Gross Profit Margin, and it shows how profitable each sale truly is. The formula for this is (Gross Profit / Revenue).
In Excel terms, that would be =H2/E2. Once you've entered the formula, make sure to format the cell as a percentage. A higher margin is a great sign—it means you're keeping more money from every Rand of revenue, which could be down to smart pricing or keeping your production costs low.
Pro Tip: What's a "good" gross profit margin? It really depends on your industry. For a retail business, hitting 50% or more is generally considered pretty solid. On the other hand, a software company might be looking at margins well over 80%. It's always a good idea to check out industry benchmarks to see how you stack up.
Finding Your True Earnings with Net Profit
Gross profit is a great starting point, but it only paints half the picture. To get a real sense of your business's financial health, you need to look at your net profit. This is the ultimate bottom line—the actual cash left over after you've paid for everything.
This means accounting for all your operating expenses. These are the day-to-day costs of running the business, the things that keep the lights on, even if they aren't directly linked to making your product or delivering your service.
Identifying Your Operating Expenses
So, what counts as an operating expense? Think bigger than just the cost of your goods. It's a broad category that covers all the essential overheads.
You'll want to track things like:
- Salaries and wages for your incredible team.
- Rent for your office, workshop, or storefront.
- Utilities such as electricity, water, and internet access.
- Marketing and advertising budgets.
- Software subscriptions, admin fees, and bank charges.
This infographic neatly shows how you get from your gross profit down to your net profit.
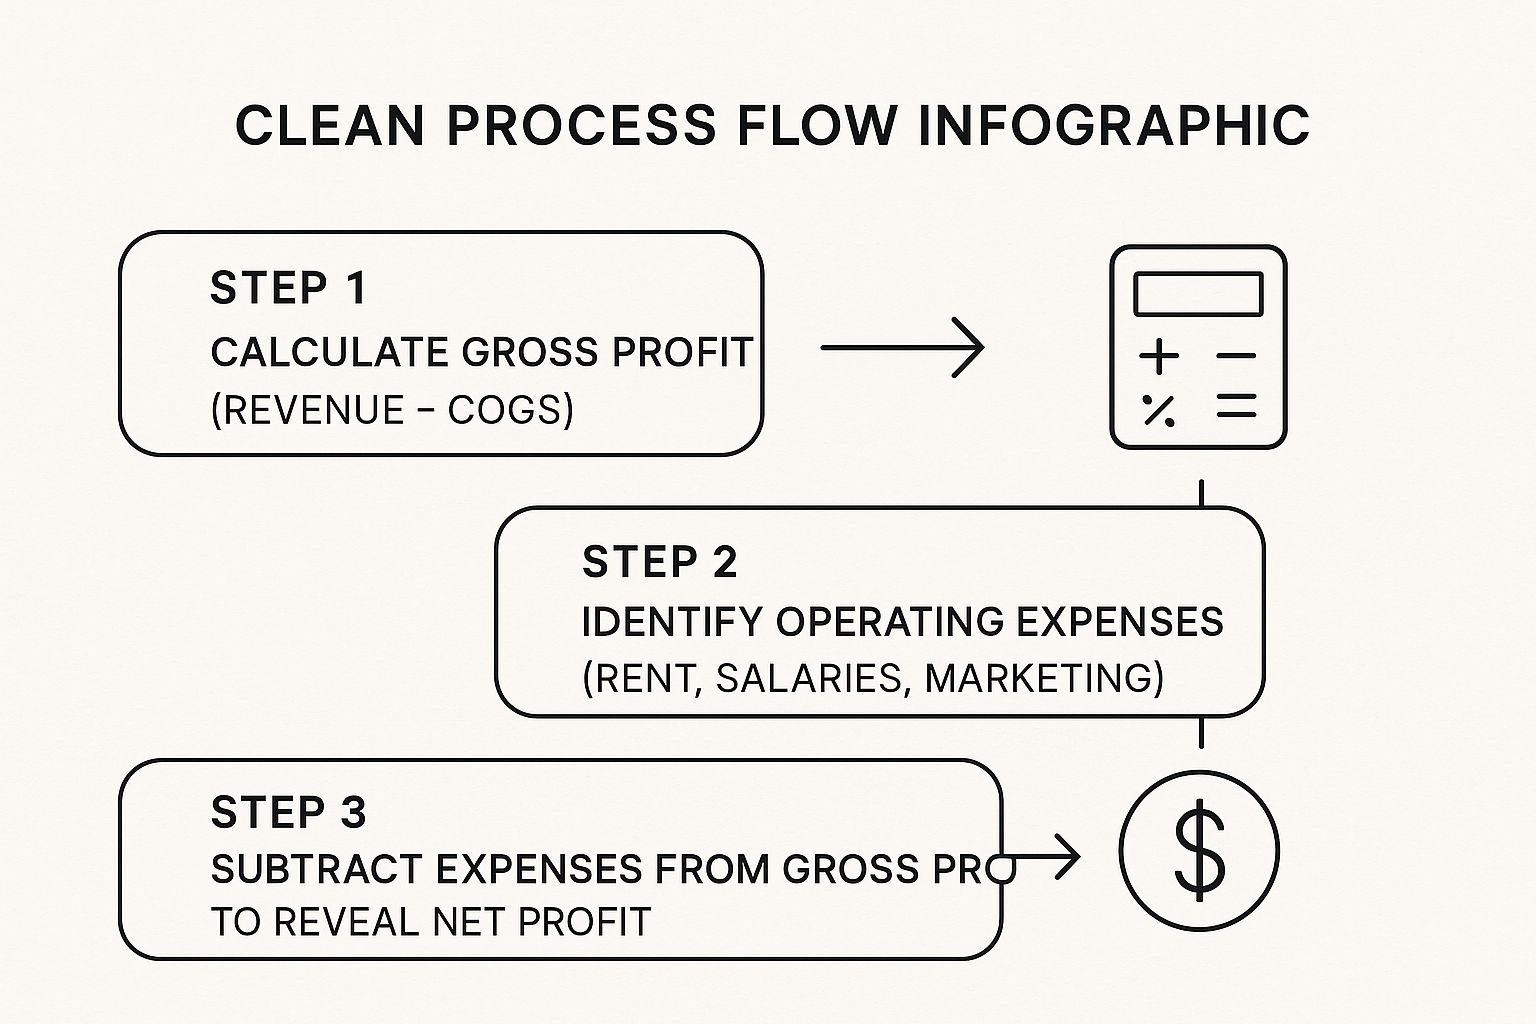
As you can see, once you have your gross profit figure, it’s a straightforward path to find your net profit.
The formula in Excel is refreshingly simple: =Gross Profit - Total Operating Expenses.
Let's imagine you're running a service business in Durban. Your first move in the spreadsheet should be to create a new section dedicated to listing every single one of these costs. This is where the SUM function becomes your best friend.
Here's a practical way to set up your operating expenses and get a total.
By calculating your total operating expenses in one cell, you can then just subtract it from your gross profit. The result is your net profit, giving you that crucial, final measure of how your business is really performing.
Visualising and Automating Your Profit Data
Crunching the numbers in Excel manually every month isn't just a drag; it's a recipe for human error that can cost you dearly. The real power of a spreadsheet isn't just in basic maths—it's in turning it into a dynamic dashboard. By getting clever with automation and visualisation, you can transform a wall of static numbers into a seriously useful business intelligence tool.

This whole process kicks off with automating how you categorise and add up your data. This is where you can start feeling like an Excel pro.
For a business here in ZA, let's say a local shop sells 1,000 units of a popular item at R50 each. The cost for each unit is R20. A quick setup in Excel can automatically show their total revenue (R50,000), total cost (R20,000), and the resulting profit (R30,000). When these calculations happen on their own, it frees up time to actually monitor profitability and make smart decisions on the fly.
Excel Functions for Profit Analysis
To make this automation happen, you need to get comfortable with a few key Excel functions. They look a bit intimidating at first, but once you get the hang of them, they'll save you countless hours.
| Excel Function | Primary Use Case | Example of Use |
|---|---|---|
SUMIF |
Adds up cells that meet one specific condition. | Summing all expenses under the "Marketing" category. |
SUMIFS |
Adds up cells based on multiple conditions. | Calculating total sales for a specific product in a specific month. |
VLOOKUP |
Finds and retrieves data from a specific column in a table. | Pulling the price of a product from a master price list into your sales sheet. |
PIVOTTABLE |
Summarises, sorts, and analyses large datasets dynamically. | Creating an interactive summary of sales by region, product, and quarter. |
These functions are the building blocks of a truly automated profit and loss sheet, ensuring your calculations are always accurate and based on the latest figures.
Turning Numbers Into a Clear Story
Once your calculations are automated, the real magic begins: visualisation. Let’s be honest, staring at rows and columns of raw numbers can make your eyes glaze over. A simple chart, on the other hand, tells a story instantly.
With a well-designed visual, you can spot trends, identify outliers, and understand the impact of your business decisions at a glance. It’s about making your data work for you, not the other way around.
Imagine seeing your net profit margin plotted on a line graph over the past year. You'd immediately see the dip when you bought that big piece of equipment or the spike from that killer December sales campaign. It's a game-changer.
Here are a few charts I always recommend starting with:
- Bar Chart: Great for comparing the profitability of different products or services side-by-side.
- Line Chart: Perfect for tracking metrics like gross or net profit over time to see seasonal patterns.
- Pie Chart: A classic for a reason—it shows you exactly where your money is going by breaking down your total operating expenses.
Of course, Excel is just the beginning. Many businesses take it a step further with dedicated platforms. It's worth exploring some business intelligence dashboard examples to see what's possible when you really lean into data visualisation. This approach turns profit tracking from a monthly chore into a source of continuous, actionable insight.
Got Questions About Calculating Profit in Excel? We’ve Got Answers.
As you start getting the hang of tracking your business finances in Excel, you'll probably run into a few tricky spots. It's completely normal. Nailing these details is crucial, though, because accurate numbers lead to smarter business decisions.
Let's walk through some of the most common questions that pop up.
What’s the Real Difference Between Markup and Profit Margin?
This one trips up a lot of people. While they sound similar, markup and profit margin tell you two very different things about your pricing and profitability.
Markup is all about how much you mark up your products from their cost. Think of it as the "add-on." If a product costs you R50 to acquire and you sell it for R80, your markup is R30. The formula looks at the cost: (Selling Price - Cost) / Cost.
Profit margin, however, shows you what slice of the final selling price is actual profit. Using that same R80 product, the profit margin is 37.5%. The formula focuses on the final price: (Selling Price - Cost) / Selling Price. They’re two sides of the same profitability coin.
How Do I Calculate Profit for Lots of Different Products?
The best way to handle this is to structure your sheet cleanly. Don't try to cram everything into a few cells. Instead, give each product its own dedicated row.
Set up your columns like this: 'Product Name', 'Units Sold', 'Price per Unit', and 'Cost per Unit'.
Once you have that foundation, you can add new columns with simple formulas to do the heavy lifting:
- Total Revenue:
=Units Sold * Price per Unit - Total Cost:
=Units Sold * Cost per Unit - Product Profit:
=Total Revenue - Total Cost
To see the big picture, just pop a SUM function at the bottom of your 'Product Profit' column. This will give you a grand total profit across all your products.
I’ve seen so many people try to lump all their products into one massive calculation. By breaking it down per product, you can instantly see which items are your cash cows and which ones are barely pulling their weight.
Why Is My Profit Formula Showing an Error?
Ah, the dreaded Excel error message. It’s frustrating, but usually an easy fix. If you see #VALUE!, it’s likely that you’re accidentally trying to do math with a cell that contains text instead of a number. Go back and make sure all your price, cost, and unit columns are formatted as numbers.
The other common one is #DIV/0!. This almost always pops up in a margin calculation when the revenue cell is zero or empty (because you can't divide by zero). You can build a safety net for this using the IFERROR function. Try this: =IFERROR((Revenue-Cost)/Revenue, 0). If there's an error, it will just show a clean 0 instead of the ugly error code.
When you’re dealing with international suppliers or customers, your profit calculations get a lot more complicated. Hidden bank fees and less-than-ideal exchange rates can slowly chip away at your bottom line. Zaro provides a clear alternative with real exchange rates and no hidden fees, making sure the profit you calculate is the profit you actually pocket. Find out how much you could save on your cross-border payments at https://www.usezaro.com.