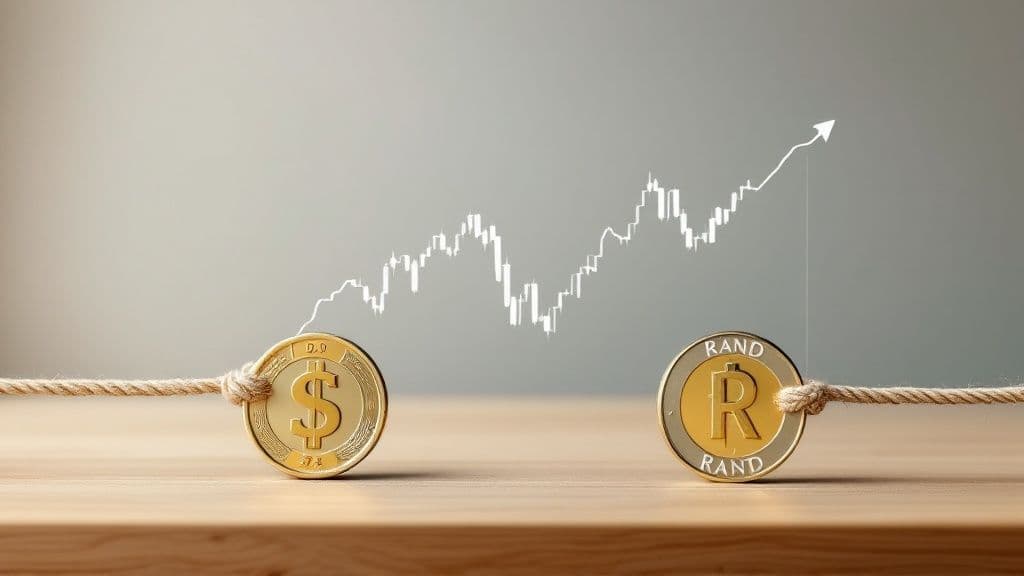
At its core, a USD/ZAR exchange rate graph is a visual story. It shows you exactly how many South African Rand (ZAR) you need to buy one US Dollar (USD) at any given moment.
Think of it this way: when the line on the graph goes up, the Rand is weakening, meaning you need more Rands to buy a single Dollar. When the line goes down, the Rand is strengthening, and your Rands suddenly have more buying power. This simple visual is the key to understanding the financial dance between the US and South African economies.
Decoding the Story of the USD ZAR Graph
A currency graph can look like a jumble of jagged lines and confusing numbers at first glance. But it’s much simpler than it seems. Picture a constant tug-of-war between the US Dollar and the South African Rand. Every single tick up or down on the usd zar exchange rate graph shows one currency gaining a slight advantage over the other, pulled by forces like economic news, investor sentiment, and major global events.
Getting a handle on this dynamic story is crucial for anyone with financial interests that cross borders. If you’re a business owner importing American goods, an exporter getting paid in dollars, or an investor with a global portfolio, this graph offers indispensable insights. Even just planning a holiday to the States becomes easier when you can spot the trends.
The Constant Push and Pull
This guide is here to walk you through it all, step by step. We’ll break down the jargon and turn complex charts into practical, easy-to-understand knowledge.
We’ll cover:
- How to read the graph: We'll start with the basics, like what the axes and trend lines actually mean.
- The key economic drivers: You'll learn what really makes the Rand strengthen or weaken against the Dollar.
- Applying this knowledge: We'll show you how to use this information to make smarter financial decisions.
Think of the exchange rate as a price tag. When the graph climbs, the "price" of a US Dollar in Rand is going up. When it drops, that same Dollar becomes cheaper for you to buy with your Rands.
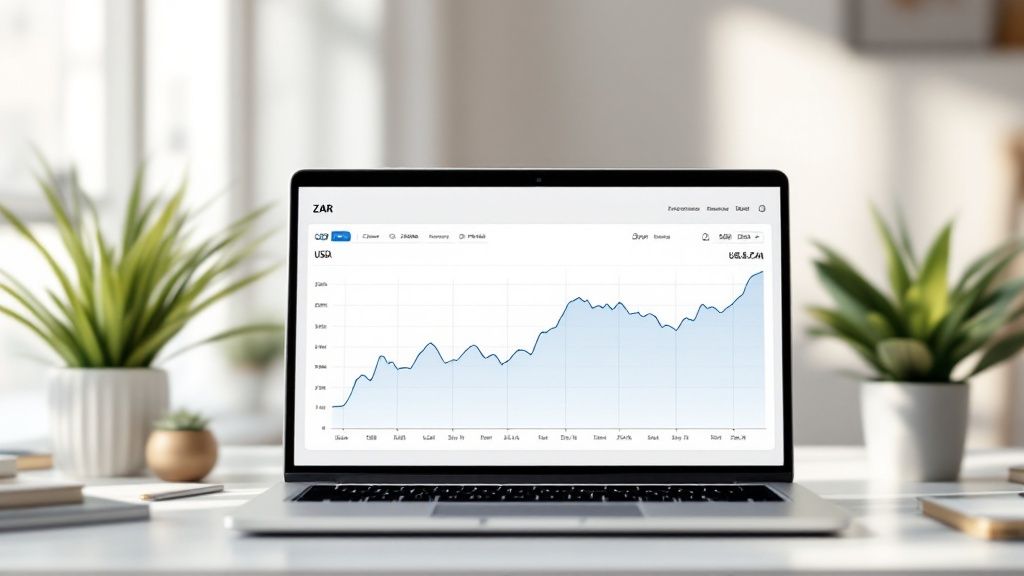
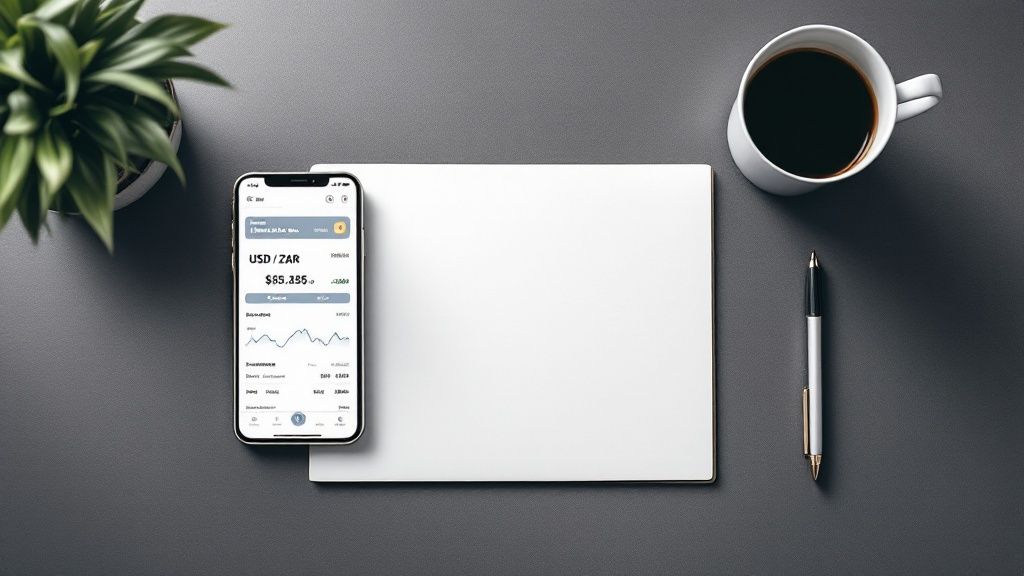
For example, take a look at the live performance of the USD/ZAR pair right now.
This snapshot perfectly captures the daily volatility, showing how the rate bounces around with every bit of market news. Once you learn to read these movements, you stop being a spectator and start making informed, confident choices with your money.
How to Read a Currency Exchange Graph
At first glance, a USD/ZAR exchange rate graph can look like a jumble of lines and numbers. But think of it like reading a weather forecast—once you know what the symbols mean, you can see the story unfolding and get a much clearer picture of the financial climate.
The graph is built on two simple axes. The vertical one (the Y-axis) running up the side shows the price. It answers the fundamental question: "How many South African Rands do I need to buy one US Dollar?"
The horizontal axis (the X-axis) along the bottom represents time. You can adjust this to see what’s happened over minutes, hours, days, or even years, letting you zoom in on daily market jitters or zoom out for the bigger picture.
Understanding the Lines and Trends
The moving line is where all the action is. It connects the dots, plotting the price points over your chosen timeframe and tracing the historical journey of the USD/ZAR exchange rate.
It’s pretty straightforward:
- A rising line shows the Rand is weakening against the Dollar. The price is climbing, meaning it costs you more Rands to buy a single US Dollar.
- A falling line means the Rand is strengthening. The price is dropping, so you need fewer Rands to get one US Dollar.
So, if you see the line move from 18.50 up to 18.75, the Rand has lost some ground. But if it drops from 18.50 down to 18.25, the Rand has gained strength. This simple up-or-down movement is the most basic, yet crucial, piece of information the graph gives you.
Different Chart Types for Deeper Insights
While a standard line chart is great for a quick overview, other formats pack in a lot more detail about what happened during each period. One of the most popular is the candlestick chart.
A candlestick chart goes beyond just showing the final price. It reveals the entire price journey for a period—the open, high, low, and close—making it an incredibly powerful tool for understanding market volatility.
Each "candle" on the chart has two parts:
- The Body: This is the thick, rectangular part. It shows you the difference between where the price started (the open) and where it ended (the close). A green body usually means the price closed higher than it opened, while a red one means it closed lower.
- The Wicks: These are the thin lines sticking out from the top and bottom of the body. They show the highest and lowest prices the exchange rate hit during that specific timeframe.
For example, a long wick tells you there was a lot of price fluctuation and indecision in the market, even if the opening and closing prices ended up being quite close.
Learning to read these visual cues helps you move past simply seeing a trend. You start to understand the sentiment driving the market, which is a critical skill for making smart financial decisions, whether you're paying an international supplier or bringing your dollar earnings back home to South Africa.
What Moves the USD/ZAR Exchange Rate
That squiggly line on a USD/ZAR exchange rate graph isn’t just moving at random. It’s actually telling a story, a constant back-and-forth between the economic health of South Africa and the United States. Think of it like a tug-of-war, where a dozen different factors are pulling the rope in either direction, causing the Rand to either gain ground or lose it against the Dollar.
Getting a handle on these drivers is the first step to reading the graph like a pro. For South Africa, so much of our economy is tied to what we pull out of the ground. We're a massive exporter of precious metals like gold and platinum, and since these are priced in US Dollars, their global prices have a huge say in the Rand's value. When commodity prices are high, more Dollars flow into the country, which usually gives the Rand a boost.
When those prices fall, so does the inflow of Dollars, and that puts pressure on our currency. This is why you'll often hear the ZAR called a "commodity currency"—its fate is closely linked to the raw materials we sell to the world.
South African Economic Drivers
Looking closer to home, several local factors have a major impact on the Rand. The South African Reserve Bank (SARB) is a key player here. Its decisions on interest rates are watched like a hawk by investors everywhere. When the SARB hikes rates, it can make South Africa a more attractive place for foreign capital, as investors chase better returns. This demand for the Rand helps it strengthen.
On top of that, the market is always reacting to key economic data releases. These include:
- Inflation Figures: High inflation eats away at a currency's buying power, which typically pushes the Rand weaker.
- GDP Growth: A growing economy is a healthy economy. Positive GDP numbers tend to attract investment and lift the currency.
- Political Stability: Money is notoriously shy. Any hint of political uncertainty can cause investors to pull their capital out, weakening the Rand in the process.
All these pieces fit together to create the daily drama you see playing out on the exchange rate graph.
The image below gives you a clean visual breakdown of the main forces pulling the strings on the USD/ZAR pair.
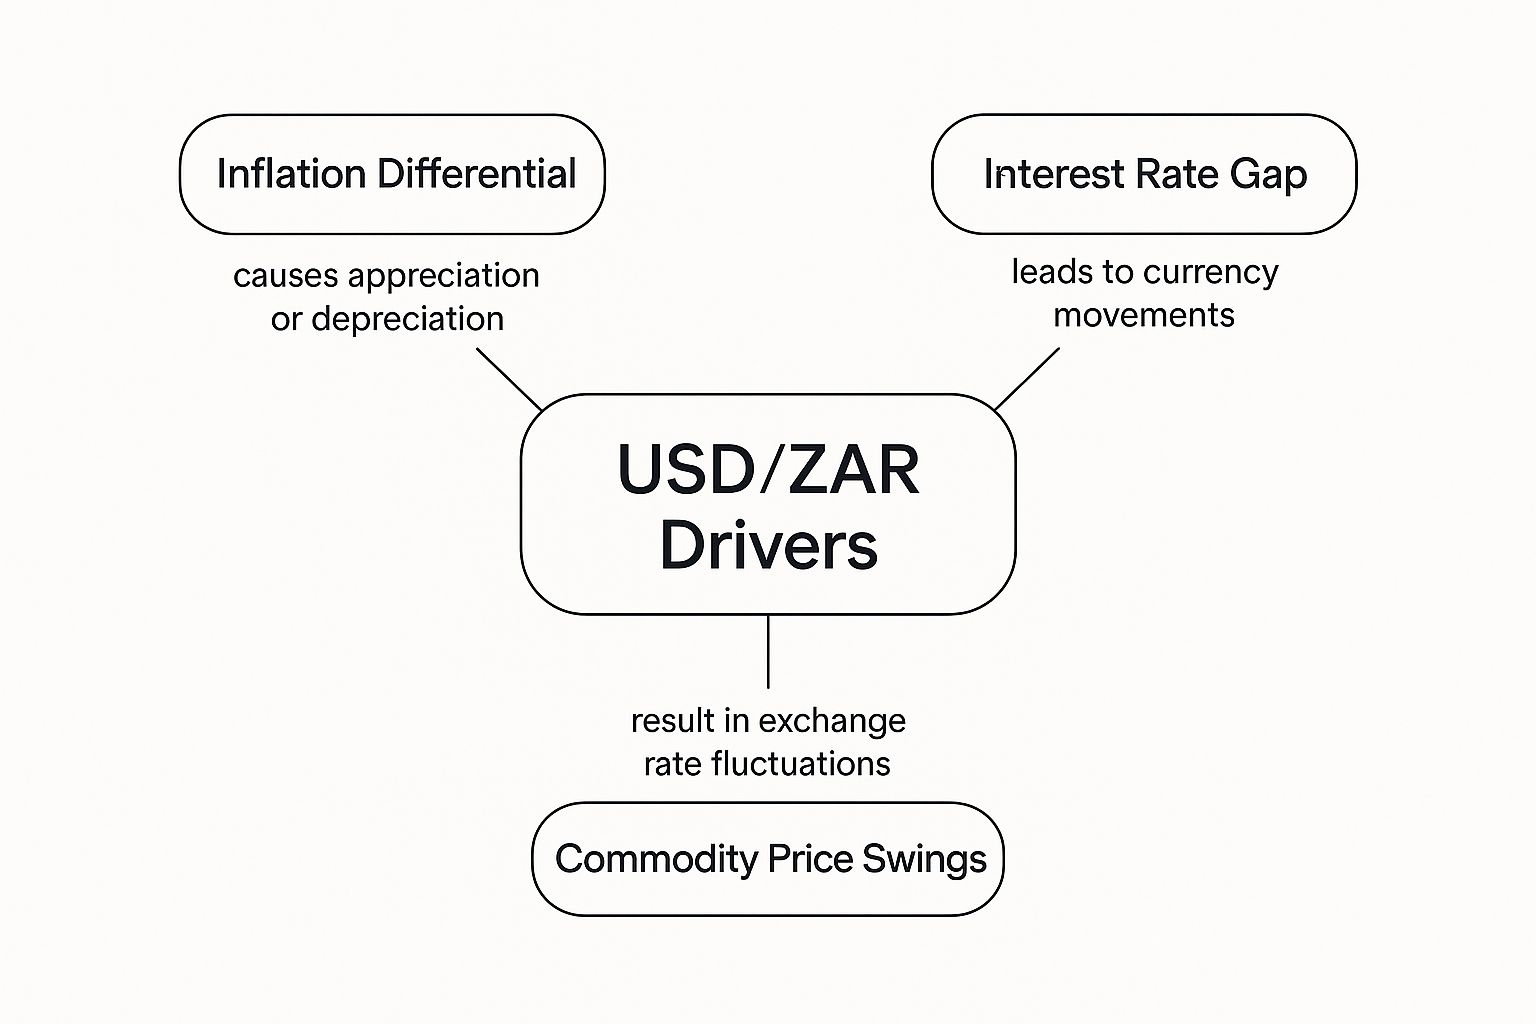
As you can see, it boils down to a contest between inflation rates, interest rate decisions, and the ever-present influence of commodity prices.
United States Economic Influence
Of course, the Rand isn't acting in a vacuum. The other half of the story is the US Dollar itself. As the world's go-to reserve currency, the Dollar’s strength is a reflection of the American economy, and the US Federal Reserve (the Fed) is in the driver's seat. When the Fed raises its interest rates, holding Dollars becomes more appealing, sucking in capital from across the globe and strengthening the USD against other currencies, including our ZAR.
Big-ticket US economic news, like the monthly jobs report or GDP figures, can also send ripples through the market. A strong US economy generally means a strong Dollar, which you’ll see as a higher USD/ZAR rate.
We saw a clear example of this in action recently. Between 5 March and 1 September of last year, the Rand actually gained about 3.83% on the Dollar. The rate swung from a high of R19.742 all the way down to a low of R17.449 in that window, proving just how much these economic forces can move the needle.
By understanding both sides of this economic "tug-of-war," you can begin to connect major news events—from a SARB announcement to a US jobs report—to the real-time movements on the graph.
To get an even better grasp on how global events shake up currency values, it’s worth digging into the various macroeconomic indicators. This knowledge is what turns a simple chart from a line on a screen into a rich, unfolding story of global economics.
Getting to Grips with Historical Trends and Volatility
To really understand where the Rand might be heading, you first need to look at where it’s been. A USD/ZAR exchange rate graph isn't just a snapshot of today's price; it's a living history book, charting every economic high, political drama, and global shock along the way. By digging into this history, you start to get a real feel for the Rand's character and just how quickly it can react to market pressures.
Every sharp spike and deep valley on that chart tells a story. These aren't just random wiggles; they’re the market’s knee-jerk reactions to major events. Cast your mind back to the 2008 financial crisis or, more recently, the global scramble during the COVID-19 pandemic. Both events left a clear fingerprint on the USD/ZAR graph, sending volatility through the roof as investors bailed on riskier assets and piled into the perceived safety of the US Dollar.
It’s not all about global news, though. Events at home often hit the Rand just as hard, if not harder. A cabinet reshuffle, a major policy speech from the National Treasury, or a dreaded credit rating downgrade from Moody's or S&P can cause the currency's value to swing wildly. By studying how the Rand reacted to these situations in the past, you can build a mental playbook for how it might behave when similar events crop up again.
Pinpointing Historical Highs and Lows
Zoom out on a long-term graph, and you’ll immediately spot the extreme peaks and troughs. These aren’t just abstract numbers; they’re critical markers that show you the currency's historical breaking points and its incredible capacity to bounce back.
So, what triggers these massive swings? It’s rarely one single thing. More often, it's a "perfect storm" of factors hitting all at once.
- Global Risk-Off Sentiment: When fear grips global markets, investors tend to dump assets from emerging economies like South Africa. They sell the Rand and buy US Dollars, causing the ZAR to weaken dramatically.
- Homegrown Crises: Nothing spooks investors like domestic uncertainty. Severe loadshedding, political instability, or disappointing economic data can seriously damage confidence and put the Rand under immense pressure.
- Commodity Price Shocks: South Africa's economy is deeply tied to commodities. A sudden crash in the price of gold, platinum, or coal slashes the country's export earnings, which almost always translates to a weaker ZAR.
When you start connecting these historical price movements to actual events, you stop being a passive observer and start understanding the story the graph is telling. This context is absolutely vital for developing a well-rounded, long-term perspective on the currency.
The USD/ZAR pair has a history filled with volatility. For instance, a potent mix of geopolitical tensions, domestic economic challenges, and shaky global markets once saw the exchange rate spike to an all-time high of around R19.93 to the Dollar. But the Rand is nothing if not resilient. Just a few months later, the rate had pulled back to R17.73—a remarkable 11% recovery from its peak. In fact, over the 12 months prior, the Rand had actually strengthened slightly by 0.67%, proving its ability to claw back ground even in a tough climate. You can dive deeper into these historical currency moves on platforms like Trading Economics. This kind of context is crucial because it reminds us that even after hitting extreme levels, the market eventually finds its balance again.
Making Smart Moves with Live Graphs
It’s one thing to understand the theory behind a USD/ZAR exchange rate graph, but the real magic happens when you use that knowledge to make smarter financial decisions. For both businesses and individuals, this isn't just a chart with moving lines; it's a powerful tool for timing your financial moves perfectly, whether you're paying an international supplier or planning your next overseas holiday.
Instead of just accepting whatever rate you get on the day, keeping an eye on the graph allows you to be proactive. This small shift—from reacting to the market to anticipating it—can mean saving thousands of Rands and turning what feels like random market swings into a real opportunity.
Real-World Scenarios for Businesses and Individuals
Let's break down how different people can use a live graph to their advantage. These aren't just abstract ideas; they have a direct impact on your business's bottom line or your personal budget.
For Importers: Say you run a business in South Africa importing electronics from the US. You have a $50,000 invoice to settle. You've been watching the graph and see the rate dip from R18.50 to R18.10. By seizing that moment to make your payment, you've just saved yourself a cool R20,000. That’s a significant saving on just one transaction.
For Exporters: On the flip side, if your business exports local goods and gets paid in dollars, timing is your best friend. Cashing out your USD earnings when the Rand is weaker—say, at R18.50 instead of R18.10—means more Rands in your South African bank account. This can directly boost your operating capital and profitability.
For Investors: If you're looking to buy US stocks, you'd want to watch for a stronger Rand to make your initial investment go further. Later, when you're bringing your profits back home, you'd wait for the Rand to weaken to maximise the ZAR value of your returns.
For Travellers: Planning that dream trip to New York? The exchange rate is a massive factor in your spending budget. Buying your dollars when the Rand is performing well gives you more bang for your buck, making everything from your hotel to your sightseeing tours that much more affordable.
By actively tracking the live exchange rate, you stop being a passive price-taker and become an informed decision-maker. The graph gives you the clarity you need to act at the most financially opportune moments.
This is where tools like Zaro's currency converter come in, giving you this crucial real-time data at your fingertips.
What you’re seeing here is the live mid-market rate, which cuts through the noise and shows you the true cost before you commit. The transparency is key. It ensures your decisions are based on the actual, up-to-the-minute rate, not an inflated one. This is how you start making truly data-driven financial choices in a global economy.
Your Toolkit for Navigating the USD/ZAR Market
At the end of the day, a USD/ZAR exchange rate graph isn't just a line fluctuating on a screen. Think of it as a story—the ongoing economic narrative of two countries, condensed into a single visual. For anyone dealing with rands and dollars, it’s a vital tool that can bring real clarity to your financial planning.
Learning to read it properly is where you turn raw data into a genuine advantage.
It all begins with the fundamentals: getting comfortable with the axes and what the trend line is telling you. Is the line climbing? That’s a weakening rand. Is it dropping? That means the rand is gaining strength. This one insight is the cornerstone of everything else.
From there, you start connecting those squiggles on the chart to what’s actually happening in the world.
When you start paying attention to the big economic drivers—things like interest rate decisions from the SARB, shifts in commodity prices, or a major US jobs report—you suddenly understand why the graph is moving.
Finally, layering in some historical context allows you to spot familiar patterns. You’ll see how the rand has reacted to crises in the past, notice its typical cycles of volatility, and get a feel for its underlying resilience.
With these skills in your back pocket, you can look at a live chart with confidence. You’re no longer just guessing; you're making properly informed decisions. Whether you’re timing a large international payment for your business or planning a personal transaction, you now have what it takes to navigate the currency market with much greater precision. You can finally turn that complex financial data into a smart, practical strategy.
Got Questions About the USD/ZAR Graph? We’ve Got Answers.
Even after you get the hang of reading currency charts, some specific questions always seem to pop up. Let's tackle a few of the most common ones people ask about the USD/ZAR graph.
What’s the Right Timeframe to Look At?
The honest answer? It completely depends on what you're trying to achieve.
If you’re a business owner paying a monthly invoice in dollars, a daily or weekly view will give you all the context you need to catch short-term swings. But if you're doing long-term strategic planning or trying to understand bigger economic shifts, you'll want to zoom out and look at the graph over several years.
Why Does the Rand Weaken So Dramatically?
The South African Rand is what's known as an emerging market currency, and that label comes with a bit of a rollercoaster ride. It's far more volatile than currencies from bigger, more established economies like the US.
Essentially, the Rand is very sensitive to what global investors are feeling. When things get shaky on the world stage, investors often pull their money out of assets they see as risky and rush towards "safe-haven" currencies like the US Dollar. This quick shift in sentiment can cause the Rand to weaken rapidly.
A common myth is that a weakening Rand is always bad news. For a South African business that exports goods and gets paid in USD, a weaker Rand is actually fantastic. Their dollar earnings suddenly stretch much further when converted back into Rands, giving their local profits a healthy boost.
Can the Graph Tell Me What the Rate Will Be Tomorrow?
In a word, no. While the USD ZAR exchange rate graph is an incredible tool for seeing where we've been and spotting historical patterns, it's not a crystal ball.
Traders use something called technical analysis to try and forecast potential movements based on past performance, but it’s not foolproof. A surprise news event, an unexpected political development, or a sudden policy change can throw all predictions out the window. Think of the graph as a powerful tool for making an informed decision, not for seeing the future.
Ready to stop guessing and start making smarter international payments with rates you can actually see? Zaro gives your business the real exchange rate, cutting out the hidden fees that eat into your profits. Learn more and get started with Zaro today.