The ZAR/USD exchange rate graph isn't just a squiggly line on a chart; it's a living, breathing story of South Africa's economic journey. It captures our highs, our lows, and everything in between. This guide is all about helping you read that story, translating the complex financial jargon into what it actually means for your wallet and your business.
Decoding the Rand's Journey
Think of the graph as a timeline of global events, local political decisions, and the ever-shifting mood of international investors. Understanding this narrative gives you practical, real-world insights.
For example, when the Rand hit an all-time low of 19.93 to the US dollar, it wasn't just a number. That sharp drop was a direct reflection of intense economic pressures both at home and abroad. You can explore more detailed currency data over at TradingEconomics.com.
Whether you're trying to protect your savings, plan an overseas trip, or manage the costs of an import business, getting to grips with the Rand's movements is absolutely crucial.
What the Exchange Rate Graph Actually Shows
At first glance, a ZAR/USD exchange rate graph can look like a jumble of peaks and valleys. But think of it less like a complex financial chart and more like a simple story of supply and demand playing out over time.
The line you see is just tracking one thing: how many South African Rands it takes to buy a single US Dollar.
The horizontal line at the bottom (the x-axis) is the timeline—this could be hours, days, or even years. The vertical line running up the side (the y-axis) shows the actual exchange rate. It's the price of a dollar, quoted in Rands.
So, when you see the line on the graph moving up, it means the Rand is getting 'weaker'. It’s taking more and more Rands to buy that same $1. If the line drops, the Rand is 'strengthening' because you need fewer Rands to get your dollar. Simple as that.
Key Forces That Move the Rand
The ZAR/USD exchange rate graph doesn't move by accident. It's a constant push-and-pull between what's happening here at home and major events on the world stage. Think of it like a seesaw, with South African factors on one side and global forces, particularly from the US, on the other.
The Balancing Act: Domestic vs. International Factors
On the home front, things like the South African Reserve Bank's interest rate decisions, our political climate, and even the stability of our power grid thanks to Eskom can either bolster the Rand or send it tumbling. A stable, growing local economy tends to attract investment, which strengthens our currency.
But it's not all about us. The biggest global player is almost always the US economy. When the US Federal Reserve makes moves, the world listens. For instance, announcements about Federal Reserve interest rate hikes can make US investments more attractive, pulling money out of emerging markets like ours. This boosts the dollar and, in turn, weakens the Rand.
This tug-of-war creates constant movement. Even week-to-week news can cause sharp swings, something you can clearly see when you look at historical currency data on a platform like Wise.com.
To give you a clearer picture, here’s a quick breakdown of the main drivers.
Key Factors Influencing the ZAR USD Exchange Rate
| Factor | Potential Impact on Rand (vs USD) | Example |
|---|---|---|
| SA Interest Rates | Higher rates can strengthen the Rand by attracting foreign investment seeking better returns. | The SARB increases the repo rate by 50 basis points. |
| US Interest Rates | Higher rates can weaken the Rand as investors move capital to the US. | The US Fed announces a rate hike to combat inflation. |
| Commodity Prices | Higher prices for SA exports (gold, platinum) can strengthen the Rand. | A global surge in platinum demand boosts its price. |
| Political Stability | Increased stability and positive news can strengthen the Rand. | A successful, stable national election. |
| Economic Growth (GDP) | Stronger SA growth can strengthen the Rand. Weaker growth does the opposite. | SA's GDP figures exceed market expectations. |
| Load Shedding | Increased frequency/severity weakens the Rand by hurting business confidence and output. | Eskom announces a move to Stage 6 load shedding. |
Understanding these factors is the first step to reading the story the exchange rate graph is telling. It’s not just a line on a chart; it’s a reflection of economic confidence, policy decisions, and global market sentiment all rolled into one.
How to Read Trends and Patterns on the Graph
So, how do you move from theory to actually making sense of the lines on the ZAR USD exchange rate graph? It starts with spotting a few key signals.
Think of support and resistance levels as the graph's invisible floor and ceiling. Support is a price level the rand seems to hit and bounce back up from, struggling to fall any lower. Resistance is the opposite – a ceiling that the exchange rate finds tough to break through.
Learning to identify these two levels is crucial. It's how you start to separate a genuine, long-term trend from what might just be short-term market "noise" or a temporary blip.
This infographic breaks down the main forces at play—local events, global pressures, and market sentiment—and shows how they all tug at the Rand's value.
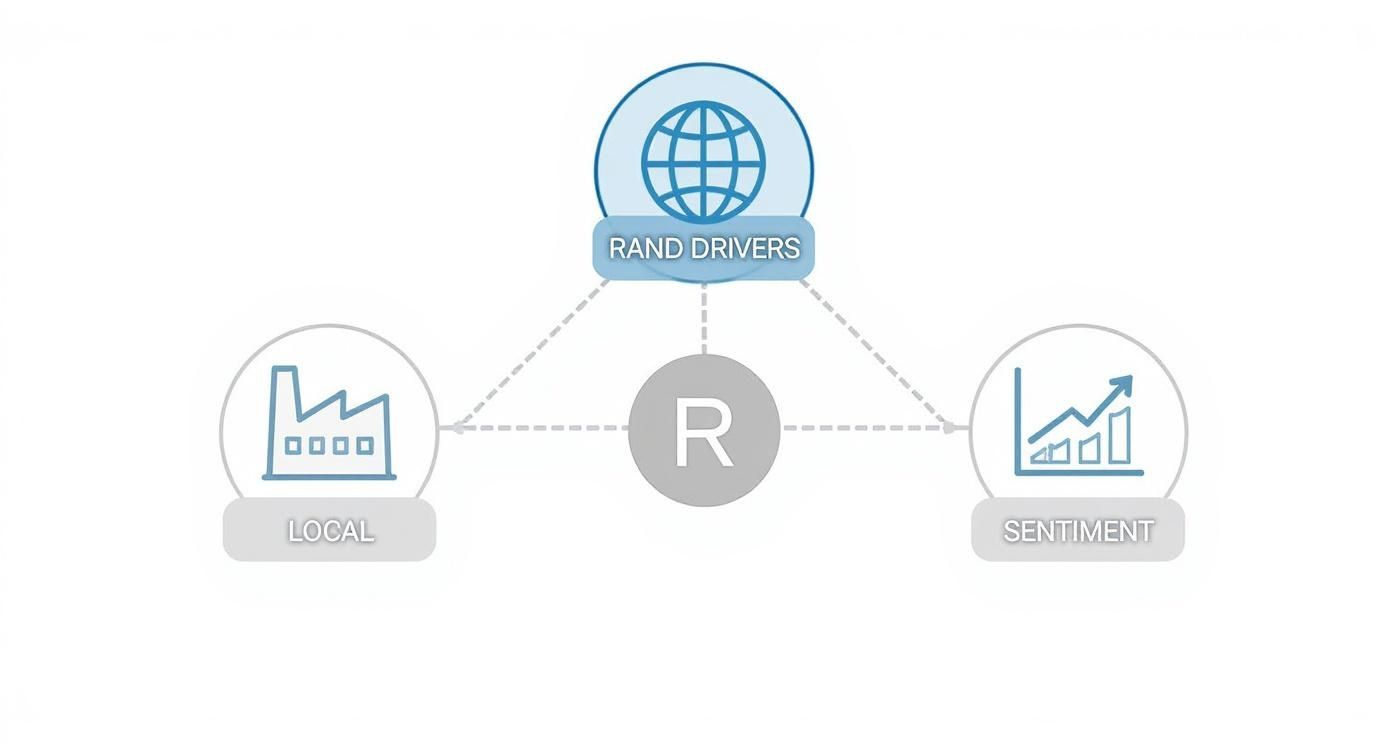
As you can see, these drivers are deeply interconnected, and together they create the movements you see on the graph.
While looking at the technicals is vital, don't stop there. Getting a feel for the human element is just as important. Understanding tools like market psychology charts can give you incredible insight into investor emotion and help you anticipate potential turning points before they happen.
A Brief History of the Rand's Performance
To really get a feel for the ZAR/USD exchange rate graph today, you have to look back at where it's been. The Rand’s journey is a rollercoaster, a story of resilience shaped by South Africa's own economic and political twists and turns.
Think about it – every major event, from the dawn of democracy in 1994 to the shockwaves of global financial crises, has left its mark on the chart, often in the form of sharp, sudden movements.
If you zoom out and look at the big picture, you'll see a clear trend: the Rand has generally weakened against the US Dollar over the long haul. Back in the early 1980s, the rate was below R1 to the Dollar. Since then, it's seen several periods of rapid devaluation.
This history isn't just trivia; it tells us that the Rand is sensitive, reacting to both decisions made at home and tremors felt across the global economy. You can dive deeper into this history and explore the long-term data for yourself.
What the Graph Means for Your Business

Okay, so we've looked at the charts and the trends. But how does this all translate into real-world Rands and cents for your company? The truth is, every wiggle on the ZAR USD exchange rate graph ripples directly through your business, affecting your bottom line.
Let's break it down into two simple scenarios.
First, if you're an importer, you're watching that graph hoping for a downward trend. A stronger Rand is your best friend. It means your Rands suddenly have more buying power, making it cheaper to bring in those electronic components, fabrics, or machinery from international suppliers. This either fattens your profit margins or allows you to pass on the savings and become more competitive.
Now, flip that around. If you're an exporter – say, a local wine farm with customers in the United States – you're cheering for a weaker Rand. When the exchange rate climbs, every Dollar you earn from your sales converts into more Rands back home. A weaker currency effectively gives your products a price cut on the global stage, making them far more appealing to buyers abroad.
Got Questions About the ZAR/USD Graph?
It's completely normal to have questions when looking at the Rand-Dollar exchange rate. It's a complex topic, after all.
We've put together some quick, straightforward answers to the most common queries we hear. This section is all about demystifying the graph, giving you the confidence to interpret the data and understand what it really means for businesses here in South Africa.