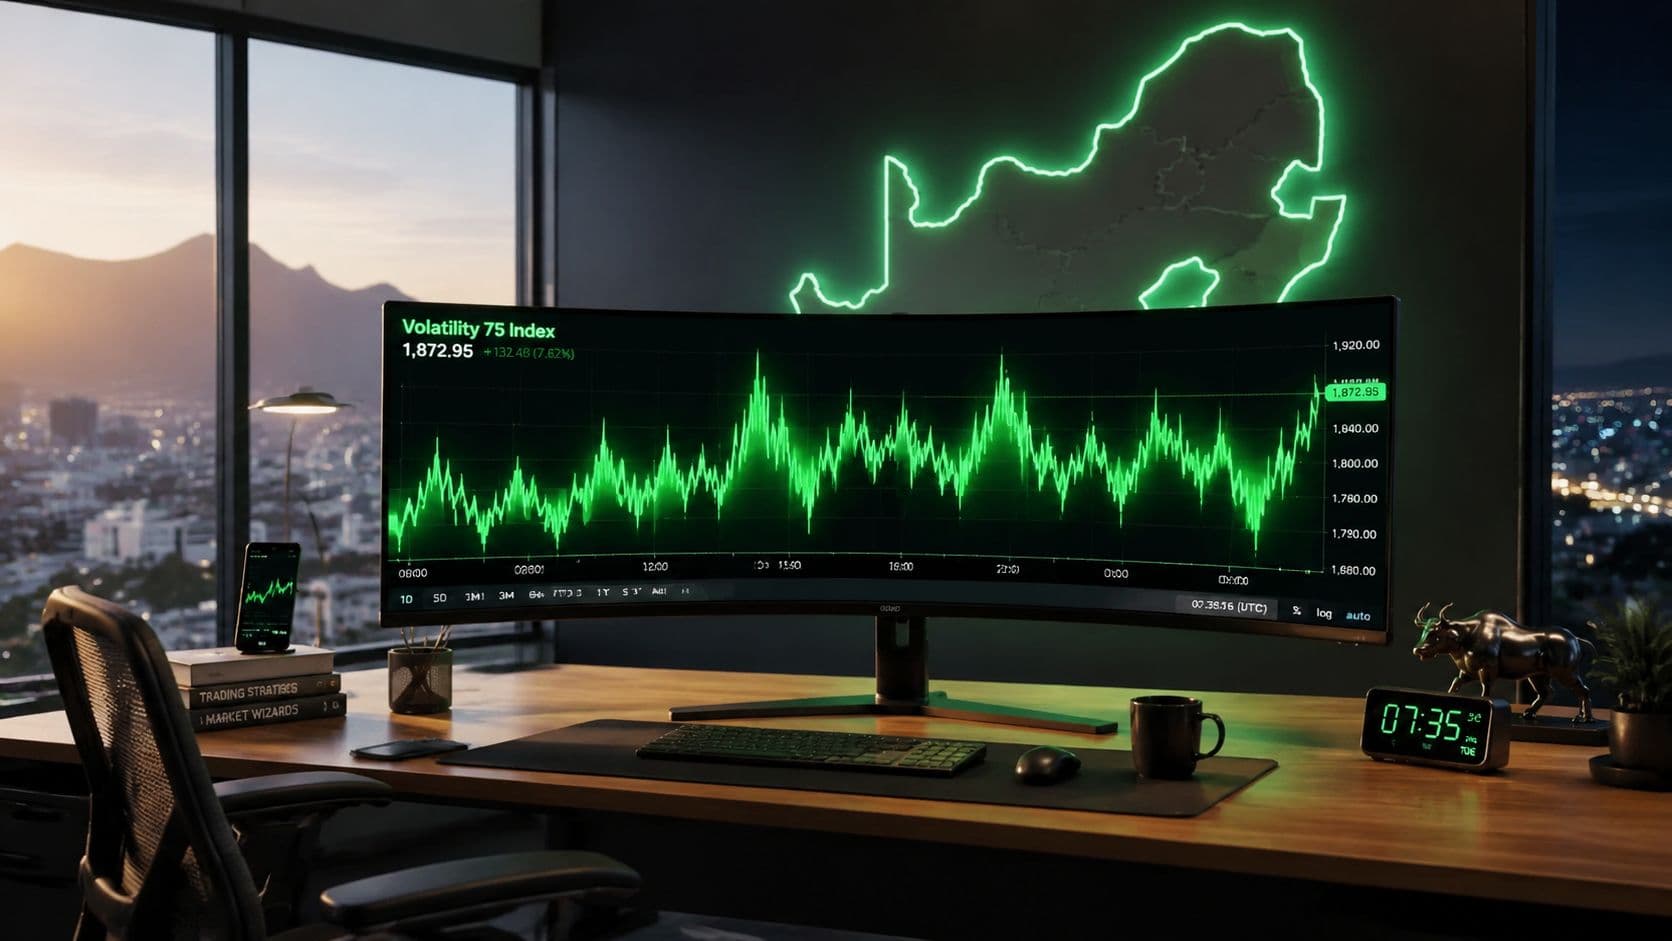
You're scanning a trading platform late at night in South Africa when a symbol called Volatility 75, or V75, catches your attention. The chart is moving, the market appears to be available outside ordinary exchange hours, and the name sounds as though it might be linked to South Africa's own volatility benchmark. That assumption can lead you into the wrong product.
The Volatility 75 Index is a synthetic trading instrument, while the JSE's South African Volatility Index, or SAVI, is an official market sentiment gauge for South African equity markets. The JSE places SAVI within its volatility-indices suite and explains that its indices aren't tradable products. SAVI measures expected market risk rather than price performance, making it useful for analysing local market conditions, but it isn't the same instrument as V75. You can review the JSE's description of the South African Volatility Index and volatility indices before treating either product as part of a risk decision.
This distinction matters for a South African trader because V75 isn't linked directly to the JSE, the rand, listed shares, or a domestic economic announcement. It's a broker-created market with its own model, pricing rules, costs and counterparty risks.
The Moment You First Saw Volatility 75 on Your Screen
A trader in Johannesburg opens a platform after dinner and sees familiar currency pairs, JSE-related products and a continuously moving V75 chart. The instrument seems convenient. There's no obvious company behind it, no earnings calendar to check and no exchange closing bell visible on the screen. The natural question is simple: is this South Africa's real volatility index?
No. The product name creates the confusion, but the structure clears it up. V75 is a synthetic index offered by certain derivatives brokers. It doesn't represent a basket of Johannesburg-listed companies, and its price isn't calculated from normal buying and selling in the South African equity market. A provider generates its quotes through an algorithm designed around a high volatility setting.
SAVI has a different role. The JSE identifies it as a market sentiment gauge for South African equity markets and places it among its official volatility indices. It's an analytical benchmark for expected risk, not a conventional product you buy and sell like a share. The JSE also explicitly notes that its indices aren't tradable products.
Why the label can mislead
A name containing “75” may sound like a market forecast, a return target or a probability. It isn't any of those. The label identifies the synthetic product's intended volatility setting, not the chance of making a profit and not a promise that the price will rise or fall by a particular amount.
The product can appear on a platform alongside foreign exchange, commodities and equity derivatives, but its placement on the menu doesn't make it a JSE instrument. Its continuous availability may also make it look more like a global market than a broker-designed product. South African market commentary describes V75 as available around the clock on the originating platform and emphasises that the price comes from the platform rather than an external market. You can read that South Africa-focused explanation of V75 for additional product context.
Before depositing money, open the broker's contract specification. Check the provider, model description, trading schedule, spreads, financing charges, withdrawal terms and whether the broker can quote a different price from another provider. That short review can prevent you from trading V75 as though it were a conventional JSE volatility product.
What the Volatility 75 Index Actually Is
The Volatility 75 Index is a synthetic derivatives instrument designed to produce market-like price movement around a target volatility level of 75%. The number describes the intended intensity of movement. It doesn't mean a 75% probability of profit, a guaranteed return or a 75% price change within a fixed period.
An engine analogy helps. Imagine a motor adjusted to run at a particular speed. The setting influences how forcefully the motor behaves, but it doesn't tell you which direction a vehicle will travel. In the same way, the volatility setting influences the expected scale of price variation, while it doesn't determine whether the next movement will be upward or downward.
Synthetic means provider-generated
A conventional share index draws value from identifiable assets. A stock exchange publishes prices from trading activity, and an options-based volatility gauge uses market prices to estimate expected movement. V75 doesn't work that way. The provider's algorithm generates the price path, and the broker presents that path to clients through a trading platform.
That structure creates several practical consequences:
- No listed-company basket: V75 doesn't represent the performance of South African shares or a group of global assets.
- No domestic economic link: A South African interest-rate announcement, rand movement or JSE trading halt doesn't automatically drive the quote.
- Continuous access: The originating platform can offer pricing beyond ordinary stock-exchange sessions.
- Provider dependence: The model, execution conditions, spreads and contract rules come from the provider and broker.
V75 belongs to a wider family of synthetic volatility indices. Other symbols may use lower or higher target settings, but the exact calculation method and contract conditions depend on the provider. Don't assume that two products with similar names behave identically on different platforms.
A useful introduction to the broader concept is this market volatility guide for traders. It can help separate volatility, direction, risk and return, four ideas that new traders often blend together.
What you're actually trading
When you open a long or short V75 position, you're speculating on the movement of a provider-generated quote through a derivative contract. You aren't buying an ownership interest in a company, and you aren't purchasing a piece of the JSE's volatility measurement.
A small movement in the quoted index may produce a much larger gain or loss relative to the margin placed on the position. That's why the product should be treated as a high-risk synthetic CFD-style speculation, not as a passive investment or a local-market hedge.
How a Synthetic 75% Volatility Index Is Built
A synthetic index is produced by a mathematical model rather than a conventional exchange auction. The provider selects rules and a target volatility setting, generates returns, and applies those changes to a reference price. The result is a continuing price path. For a South African trader, this is the key distinction from SAVI, the JSE's real volatility index. V75 is a provider-generated product, not a measure created from trading in JSE securities.

The construction process
A simplified version works as follows:
- The provider defines a mathematical model. The model sets the rules used to generate price changes.
- The model targets 75% volatility. This setting describes intended variability in returns, not whether the next movement will rise or fall.
- Provider-controlled inputs create a price path. A random or pseudo-random process may generate changes within the model's limits.
- The broker distributes the quote. The platform applies trading terms such as spreads, execution rules, financing and risk controls.
The exact algorithm and parameters are generally proprietary. You can study the chart and test a strategy, but the chart does not represent a transparent exchange order book. Buyers and sellers are not independently meeting in a conventional auction to establish the price.
The product also does not rely on a closing bell, earnings season or scheduled economic release to generate every movement. Quotes may continue while the broker accepts trades. Actual availability still depends on the broker's terms, maintenance periods and risk controls.
A simple illustration
Suppose a hypothetical V75 quote is 1,000 and the model produces a 0.10% upward tick. The next quote would be about 1,001, before spreads or execution effects. With 100:1 financial gearing, that underlying movement could equal a 10% return on the position's margin. A movement of the same size in the opposite direction could create a similarly large loss.
These figures explain the relationship between price movement, gearing and margin. They are not a V75 formula or forecast. Actual results depend on contract size, margin, spread, execution, financing and broker rules.
Review the product specification before testing a strategy. Check minimum and maximum tick changes, limits, overnight treatment and the circumstances in which trading can be suspended.
Practical rule: Understand how the quote is generated before interpreting the chart. A familiar-looking chart can represent a market different from an exchange-traded asset. For ZA risk decisions, do not treat V75 as a substitute for the JSE's SAVI or as a direct local-market hedge.
How V75 Compares to Other Volatility Indices
V75 makes more sense when you place it beside other synthetic volatility products and then compare the whole group with SAVI. Names such as V10, V25, V50, V75 and V100 generally refer to different target-volatility settings within a provider's synthetic family. A higher setting is intended to produce more variable movement, but it doesn't guarantee a particular sequence of candles or a specific trading result.
The comparison below is conceptual. Providers may apply different contract specifications, spreads, tick rules and execution conditions, so a trader should verify the details on the platform offering the product.
| Index | Type | Volatility Setting | Typical Tick Behaviour | Trading Hours | Underlying Driver |
|---|---|---|---|---|---|
| V10 | Synthetic index | 10% target setting | Lower intended variability | Provider-defined, often continuous | Algorithmic model |
| V25 | Synthetic index | 25% target setting | Moderate intended variability | Provider-defined, often continuous | Algorithmic model |
| V50 | Synthetic index | 50% target setting | Higher intended variability | Provider-defined, often continuous | Algorithmic model |
| V75 | Synthetic index | 75% target setting | High intended variability | Provider-defined, often continuous | Algorithmic model |
| V100 | Synthetic index | 100% target setting | Very high intended variability | Provider-defined, often continuous | Algorithmic model |
| SAVI | JSE volatility index | Market-derived expected risk measure | Reflects expected movement in South African equity markets | Linked to JSE market arrangements | Real equity and options market conditions |
The important difference is not just the number
A lower synthetic setting doesn't turn the product into a stock index. V10 and V25 remain provider-generated instruments, just as V75 does. Conversely, SAVI's role isn't to provide a chart for ordinary directional speculation. The JSE presents SAVI as a gauge of expected market risk, and its indices aren't tradable products.
For a South African portfolio, SAVI can provide context about local equity sentiment. V75 is a standalone speculative instrument whose price is generated by a provider. One reflects conditions in a real capital market. The other simulates market-like behaviour according to an algorithm.
Do not use SAVI as a proxy for V75. A rise in South African equity fear may affect how you manage local assets, but it doesn't establish where a synthetic V75 quote should trade.
The difference also changes the meaning of “market hours”. SAVI belongs to the JSE environment. V75 may remain available when the JSE is closed, including periods when South African shares aren't trading. That convenience can encourage overtrading, especially when a trader mistakes constant access for constant opportunity.
How the Volatility 75 Index Behaves in Practice
A V75 chart can look orderly and chaotic at the same time. The provider aims to keep the statistical intensity of movement around its target, but the setting doesn't determine direction. A calm sequence can be followed by a sharp move, and a short-lived reversal can take price back through a level that looked technically significant.
The key point is that the 75% setting describes variability, not direction. It doesn't say that buyers are stronger, that sellers are likely to win or that a particular chart pattern will succeed. It describes the intended behaviour of price changes generated by the model.

Read the chart without importing JSE assumptions
A trader may look for familiar support, resistance, breakouts or mean reversion. Those tools can still be tested, but their interpretation requires care. V75 has no company announcement, dividend decision or South African economic release behind a sudden move. A price reaction is part of the generated process, not a response to publicly traded fundamentals.
The market can also be available when the trader's attention is weakest. A Sunday evening or public holiday may show the same kind of algorithmic movement as a weekday. The quote doesn't know whether you're rested, distracted or trying to recover a loss.
For broader perspective on how traders interpret measures of changing market conditions, this resource on market volatility indicators and models is useful. The distinction between a volatility measure and a directional signal remains essential when reading any chart.
A short educational video can also help visual learners recognise the difference between a synthetic chart and a conventional exchange product.
What repeated patterns do and don't tell you
Because a synthetic model follows defined rules, traders can backtest strategies against historical price data. That doesn't prove a method will remain profitable. A strategy can fit past behaviour, ignore transaction costs or fail when execution conditions change.
Technical levels can also attract many traders at once. Stops placed too close to obvious highs and lows may be triggered during normal variation before price reverses. That isn't evidence that the broker has targeted your individual stop. It's a reminder that a high-volatility chart can move through crowded levels quickly.
Treat every backtest as a question, not a verdict. Include spreads, slippage where relevant, position size and the possibility that your own decisions will differ from the historical rules.
Trading Considerations and Risk Management
V75 gives South African traders continuous access to a fast-moving synthetic market. That convenience can make risk control more important than the entry signal. A strategy that appears manageable with a small position may become destructive when repeated trades build exposure.
Begin with the stake mechanics. If each tick on a $1 stake moves profit by $0.01, a 50-cent adverse spike can wipe out 50 ticks. These figures come from the product illustration for this guide. The practical lesson is broader: calculate the cash value of a tick before deciding how many positions to open.
Build the position around the stop
Position sizing determines whether a stop-loss exit is financially survivable. Set the maximum loss first, then work backwards from the stop:
- Set the maximum loss first: Decide how much account capital you can accept losing if the trade fails.
- Calculate the distance to the stop: Use chart structure and the broker's tick value, rather than choosing an arbitrary stake.
- Reduce the position when the stop is wider: A wider stop paired with a smaller position may withstand normal movement better than a tight stop on an oversized trade.
- Test the cash outcome: Confirm the possible loss in your account currency before submitting the order.
Tight stops can be clipped by ordinary V75 movement. Placing the stop farther away while keeping the same position size raises the potential loss. Adjust both the stop distance and the trade size.
Protect yourself from the clock
V75 may be available continuously, while your concentration is limited. Choose hours when you are alert and able to follow your plan. A South African trader may prefer a routine aligned with ordinary local working hours because decision quality changes, even though the synthetic index does not gain a different character at those times.
Avoid martingale recovery systems. Raising the next stake after a losing trade assumes a reversal will arrive before the account runs out of capital. A sharp synthetic move can continue against the larger position, turning one loss into a sequence of larger exposures.
Write down a maximum daily loss, a maximum number of open positions and a hard cut-off time. Stop trading when you reach any limit. Resources such as Qoory's take on market tools can help organise analysis, but no platform feature can replace a rule you will obey.
Regulatory and Brokerage Notes for South African Traders
A South African trader should examine V75 through two separate questions: who created and prices the instrument, and which legal entity holds the client relationship and funds. The name shown on the platform may differ from the company responsible for the contract.
V75 is commonly offered through a broker as a synthetic derivative or CFD. It is a synthetic derivative offered outside the JSE listing framework, with no exchange-clearing connection to South African shares. Because the provider generates the price and the broker accepts the trade, your exposure includes counterparty risk. You rely on that broker to quote, execute, record and honour valid withdrawals according to its terms.
Documents to check before funding
Read the legal-entity and product documents before relying on promotional wording. Check these points:
- Regulatory status: Confirm whether the intermediary is authorised by the FSCA for the services it offers. An offshore licence does not provide South African authorisation.
- Client-money arrangements: Look for clear details on segregation, custody and what may happen if the broker fails.
- Withdrawal process: Check available currencies, identification requirements, processing procedures and how funds can reach you in South Africa.
- Dispute resolution: Identify the complaints process, governing law and any external body available if the broker does not resolve a dispute.
- Contract terms: Review spreads, financing, margin rules, trading interruptions, price adjustments and the provider's rights during unusual conditions.
A broker describing V75 as a JSE-linked benchmark would give you a seriously misleading picture of the product. Claims about guaranteed payouts or risk-free returns also warrant scepticism. Synthetic pricing leaves trading risk in place, while platform access does not ensure that every order fills at the displayed price.
Treat tax as a separate professional question
Tax treatment depends on your circumstances, trading activity, intention, records and the applicable SARS rules. Synthetic CFD profits generally need to be considered under income-tax principles, with their treatment determined by the relevant facts rather than by assumptions associated with owning JSE shares. Keep statements, deposits, withdrawals, transaction histories and costs. A South African tax professional familiar with derivative trading can assess your position.
Before funding the account, identify the provider, the contracting entity and the route your money would take if a withdrawal or complaint dispute arose. If those details remain unclear, pause and obtain clarification in writing.
Putting It All Together Before You Trade
Before opening a V75 position, ask yourself five questions:
- Do I understand the product? It's a synthetic CFD-style instrument, not the JSE's SAVI.
- Do I understand the volatility label? The 75% setting describes intended movement intensity, not direction or profit probability.
- Can I manage continuous access? The market may be available around the clock, but I need defined trading hours and a cut-off time.
- Have I tested the strategy properly? A demo account, documented rules and realistic transaction costs should come before live capital.
- Can I afford the loss? My position size, stop and maximum daily loss must be set before entry.
V75 may suit a disciplined retail trader who understands synthetic pricing, accepts broker counterparty exposure and follows defined risk limits. It won't suit someone seeking exchange-cleared exposure, ownership of an underlying asset or a JSE-style settlement process.
The most important decision isn't whether the chart looks attractive. It's whether the instrument, broker and risk structure fit your financial circumstances. Consistent algorithmic behaviour can make testing possible, but position sizing, journaling and emotional control remain your responsibility.
For South African businesses managing international suppliers, contractors or export receipts, Zaro provides transparent ZAR and USD payment accounts, real exchange rates and business controls that help separate operational FX needs from speculative trading risk. Visit Zaro to explore a more predictable way to manage cross-border payments while keeping your trading decisions within a clearly defined risk plan.